
As illustrated by above map, Arctic heating is accelerating, with temperatures showing up in the Arctic that are up to 4.41°C hotter than the average global temperature during 1880-1920.
The image below shows two plots. On the left-hand side is the temperature plot associated with above map, had a monthly mean been selected. To smooth the data, a 4-year running mean was chosen, and the plot on the right-hand side shows the associated global mean anomalies. Note that, due to this smoothing, only data from 1882 to August 2017 are displayed in the plot of the right-hand side.

It is appropriate to adjust the data by 0.5°C, as follows:
- An adjustment of 0.3°C to reflect a pre-industrial baseline (heating occurred due to people's emissions before 1880-1920);
- An adjustment of 0.1°C to reflect air temperatures over oceans (as opposed to sea surface temperatures);
- An adjustment of 0.1°C to better include polar temperatures (the top and bottom of the image at the top shows large polar areas that should not be excluded, the more so since the Arctic has the highest temperature anomalies).
The image below shows both adjusted and unadjusted data as dark blue lines, with a light-blue polynomial trend added over the adjusted data.
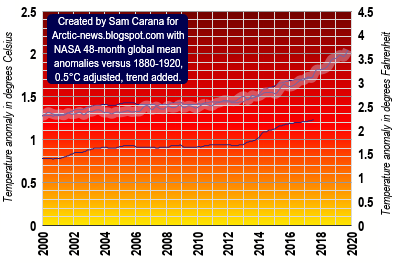 Such a trend can further smooth out seasonal differences and El Niño/La Niña variability.
Such a trend can also show the potential for further temperature rise in the near future, which can constitute an important warning.
This is particularly important as the trend shows that we could be crossing the 2°C guardrail this year, i.e. the threshold that was too dangerous to be crossed.
What is the danger? Arctic heating is accelerating, as the image at the top shows, and this could make global temperatures skyrocket in a matter of years. Where Arctic sea ice disappears, hot water emerges due to albedo changes and loss of the buffer that has until now been consuming heat as part of the melting process. This is illustrated by the image below showing the sea surface temperature difference from 1961-1990 in the Arctic at latitudes 60°N - 90°N on August 23, 2019.

Disappearance of Arctic sea ice comes with numerous feedbacks that further speed up the heating, as described in the recent post Arctic Sea Ice Gone By September 2019?. Heatwaves can strongly heat up the water that gets carried by rivers into the Arctic Ocean. As the image below shows, the water was as hot as 10.7°C or 51.3°F at green circle on August 20, 2019, i.e. 9.4°C or 16.9°F hotter than 1981-2011.

As the Arctic is heating up faster than the rest of the world, the Jet Stream gets more and more distorted. A cyclone is forecast over the Arctic Ocean for August 24, 2019, pulling hot air over the Arctic Ocean, resulting in temperatures at the green circle as high as 10.4°C or 50.6°F at 1000 hPa and 7.4°C or 45.2°F at surface level, as the image below shows.

The image below illustrates the distortion of the Jet Stream, moving over the Arctic Ocean on August 24, 2019.

Such a cyclone can pull huge amounts of hot air over the Arctic Ocean, while it can also devastate the sea ice with the destructive power of winds, rain and hail.

As above animation shows, Arctic sea ice is very thin and vulnerable at the moment. The cyclone also looks set to batter the sea ice at a time when huge amounts of ocean heat are entering the Arctic Ocean from the Atlantic and Pacific Oceans. More ocean heat looks set to be on the way. As the image below shows, sea surface temperatures around North America were as high as 33°C or 91.4°F on August 21, 2019.

The image below shows the worrying rise of Northern Hemisphere sea surface temperature anomalies from the 20th century average, with the added trend illustrating the danger that this rise will lead to Arctic sea ice collapse and large methane eruptions from the seafloor of the Arctic Ocean, further accelerating the temperature rise.
 |
| [ from an earlier post ] |
The image below shows the cyclone over the Arctic Ocean on August 26, 2019.

The image below shows a close-up of the sea ice just north of the North Pole, on August 26, 2019.

The situation is dire and calls for comprehensive and effective action, as described in the Climate Plan.
Links
• Climate Plan
https://arctic-news.blogspot.com/p/climateplan.html
• Arctic Sea Ice Gone By September 2019?
https://arctic-news.blogspot.com/2019/07/arctic-sea-ice-gone-by-september-2019.html
• July 2019 Hottest Month On Record
https://arctic-news.blogspot.com/2019/08/july-2019-hottest-month-on-record.html
Comments
Post a Comment