
As above image shows, Antarctic sea ice extent was only 1.973 million km² on February 23, 2022, the lowest on record since satellite measurements began in 1979.
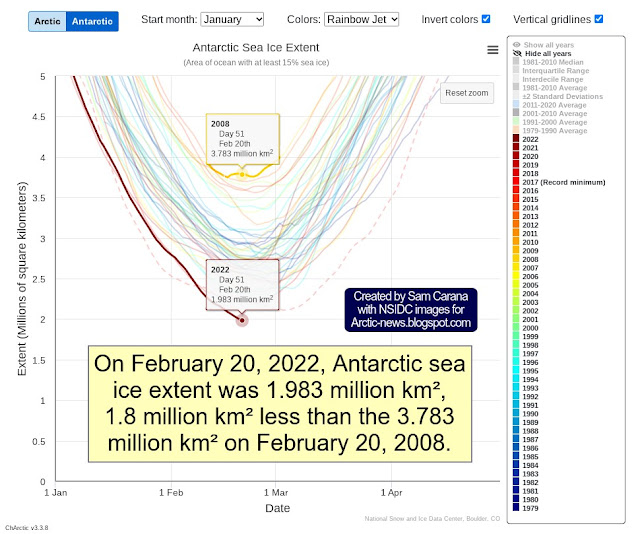
Earlier, on February 20, 2022, Antarctic sea ice extent was only 1.983 million km². On February 20, 2008, it was 3.783 million km². That's a difference of 1.8 million km², or some 0.36% of the total surface of Earth (which is 510,072,000 km²).

As illustrated by above image, adapted from IPCC AR5, incoming solar radiation at Top Of Atmosphere (TOA) is 340.4 W/m². This 340.4 W/m² is an average. The value varies depending on the seasons, i.e. the more the surface of Earth is facing the Sun, the higher this value will be (see image below, from the insolation page).
 |
| The June Solstice in 2021 occurred on June 21, 2021. |
Another variable is how many clouds and aerosols are in the sky. Much of this radiation can be reflected or absorbed by the atmosphere and some of the radiation that reaches the surface can also be reflected. Yet, on a cloud-free day, where the sky is clear from aerosols, much of the incoming solar radiation will reach the surface. It further depends on the albedo of the surface, how much will in the end be absorbed or reflected at the surface.
 |
| [ from the Albedo page ] |
Albedo refers to the reflectivity of the surface. Earth average albedo is 0.3 or 30%. The albedo of sea ice can be as high as 0.9 (i.e. 90% when covered with fresh snow). Currently, albedo of the sea ice is about 0.6 (the sea ice is partly covered with melt pools). Open water has an albedo of 0.06. So, disappearance of the sea ice makes an albedo difference of at least 0.5.
So, when taking half of 340 W/m² and multiplying this by 0.36% (i.e. the part of Earth's surface), that gives a radiative forcing of 0.612 W/m². That would mean that some 0.612 W/m² that was previously reflected (Feb 20, 2008) is now instead absorbed by the ocean (on Feb 20, 2022). If Antarctic sea ice would disappear altogether, that would correspond to another loss of some 0.612 W/m², and together with the difference between 2008 and 2022, that would add up to a total radiative forcing of 1,224 W/m².
That's almost half as much as all human-caused global warming in 2019. As the image below shows, radiative forcing was 2.72 W/m² in 2019 relative to 1750, according to IPCC AR6.

If anyone can add to or improve the above calculation, please add a comment (see box below).
Links
• NSIDC - Charctic interactive Sea Ice Graph
https://nsidc.org/arcticseaicenews/charctic-interactive-sea-ice-graph
• Wikipedia - Earth
https://en.wikipedia.org/wiki/Earth
• IPCC - Figure 2.11 (AR5/WG1/Chapter 2)
https://www.ipcc.ch/report/ar5/wg1/observations-atmosphere-and-surface/fig2-11_orig-pptx-2
• The global energy balance from a surface perspective - by Martin Wild et al. (2012)
• NASA - Earth albedo
• Albedo
• Insolation
• IPCC AR6 WG1 SPM
• Climate Plan
https://arctic-news.blogspot.com/p/climateplan.html
Comments
Post a Comment